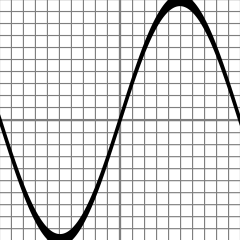
2005-09-16: I manually constructed a function tree that draws a sine wave over a grid. This is what it looks like:
This is what the C++ code for constructing the function tree looks like:
   Node *sine = new NodeSin(
      new NodeMul(new NodeX(), new NodeConst(3.141592654)));

   Node *v_dist = new NodeAbs(new NodeSub(sine, new NodeY()));

   Node *line = new NodeIfLT(v_dist, new NodeConst(0.05),
      new NodeConst(0.0), new NodeConst(1.0));

   Node *grid_x = new NodeIfLT(
   new NodeMod(
      new NodeMul(new NodeAbs(new NodeX()), new NodeConst(10.0)),
      new NodeConst(1.0)),
   new NodeConst(0.1), new NodeConst(0.0), new NodeConst(1.0));

   Node *grid_y = new NodeIfLT(
   new NodeMod(
      new NodeMul(new NodeAbs(new NodeY()), new NodeConst(10.0)),
      new NodeConst(1.0)),
   new NodeConst(0.1), new NodeConst(0.0), new NodeConst(1.0));

   Node *grid = new NodeMix(new NodeConst(0.5), new NodeConst(1.0),
      new NodeMul(grid_x, grid_y));

   Node *n = new NodeMul(grid, line);
Here's what it looks like formatted into a LISP-like symbolic expression:
(MUL (MIX (CONST 0.500000) (CONST 1.000000) (MUL (IFLT (MOD (MUL (ABS (X)) (CONST 10.000000)) (CONST 1.000000)) (CONST 0.100000) (CONST 0.000000) (CONST 1.000000)) (IFLT (MOD (MUL (ABS (Y)) (CONST 10.000000)) (CONST 1.000000)) (CONST 0.100000) (CONST 0.000000) (CONST 1.000000)))) (IFLT (ABS (SUB (SIN (MUL (X) (CONST 3.141593))) (Y))) (CONST 0.050000) (CONST 0.000000) (CONST 1.000000)))And, of course, no Genetic Programming exercise would be complete without a graphical representation of a function tree:
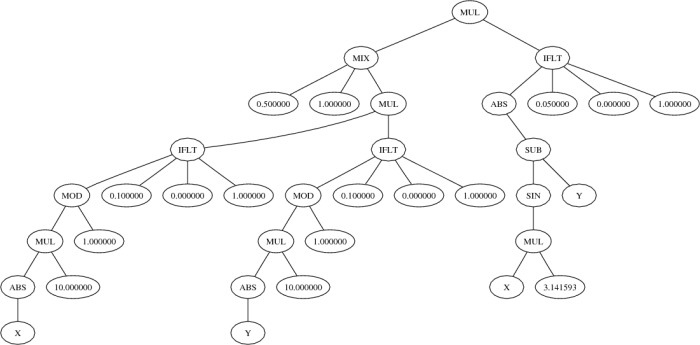
The above was generated with AT&T's excellent GraphViz, then rasterized with Ghostscript, with the help of a short Bourne script that automates the BoundingBox handling: conv.sh